Techniques In Analyzing Chart Patterns In Forex Trading Includes Reversal Candlestick, Hanging Man, Morning Doji Stars, Hammer/Pinnocio Candle, Shooting Star And Inverted Hammer
Trading forex is one of popular financial business field that most traders like. This business concerns in currency changing; buy, sell and exchange. These businesses has high risk, since there is no permanent value of currency changing and when the change will be happen. That is why being traders for scalping forex is a challenge both beginner and expert. Some techniques are available for trading such as basic strategy, simple strategy, complex strategy and advance strategy. Aand the most accurate identify entry zone area is using range high low from reversal candlesticks patterns strategy as support and resistance strong level.
Reversal Candlestick Patterns
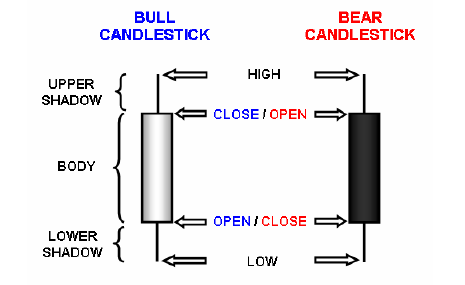
Reversal candlestick, hanging man, morning doji stars, hammer/pinnocio candle, shooting star, three dark crows, three white soldiers and inverted hammer are strategies that most traders use to read the market chart which usually presents using candlestick chart pattern, those strategies give traders information of the market which they need to make a decision in their financial business and helps them to analyze sentiment of the market. Since trading forex needs extra effort to get profit, you have to know those strategies in reading chart pattern.
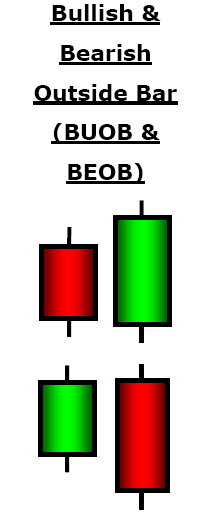
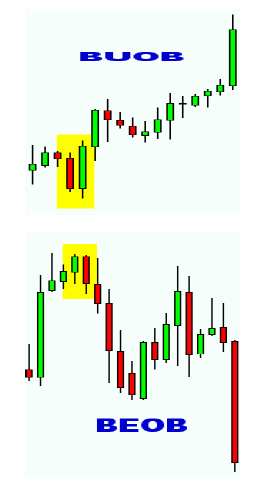
The following is explanation about those strategies. The first is reversal candlestick patterns; there are two parts of this strategy; Bearish Candlestick Reversal Patterns and Bullish Candlestick Reversal Patterns. Bearish candlestick reversal patterns consist of bearish dark cloud, bearish doji star, bearish engulfing pattern, bearish evening star, bearish evening doji star, bearish hanging man, bearish harami, bearish harami cross and bearish shooting star.
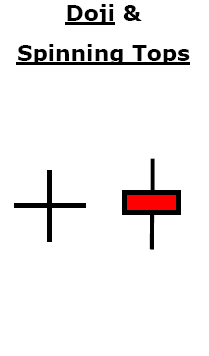
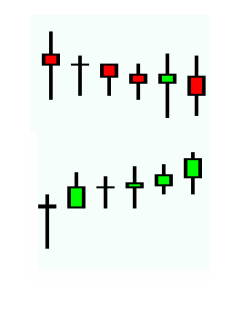
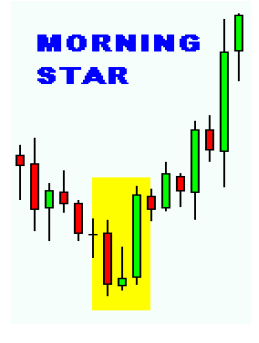
Bearish dark cloud is a strategy in seeing chart; when a long white candle formed in the first day and a gap is showed in the second day, it means that there is a possibility of bulls even the gap is not really hugh. The second is morning doji stars; this chart patterns consists of three candles; black, white and another color as doji pattern. How this pattern work, morning doji pattern is placed under the bottom of a down trend, but it does not mean that traders should buy every doji pattern shows because this pattern is showed pretty frequently.
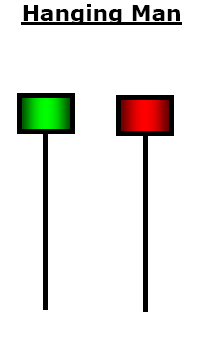
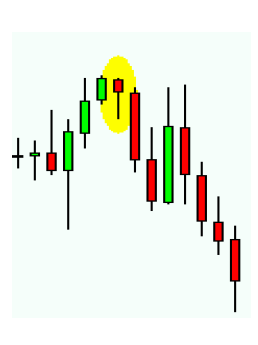
The third is hanging man pattern; it is a part of reversal bearish candlestick as well. How this pattern gives information to traders is by giving warning of potential price changing. This pattern is formed when the open price, high price and close price are different. For example, when the open price and the close price is same and the hanging man pattern is formed. It reveals either bullish or bearish.
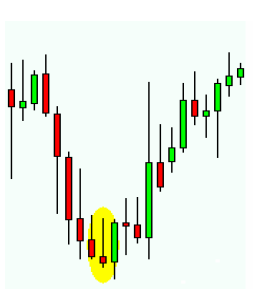
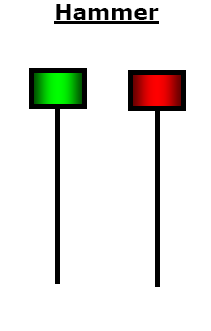
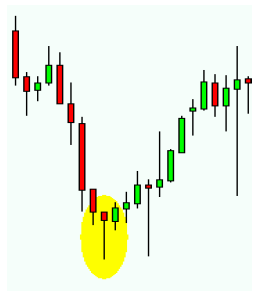
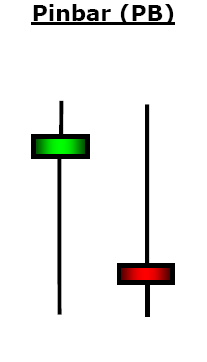
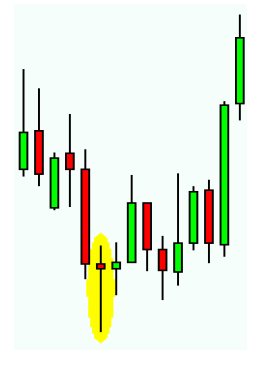
The fourth is hammer/pinnocio candle. The hammer candle is formed under the downtrend and it reveals a significant bullish; this is part of Bullish Candlestick Reversal Pattern. This pattern is formed when the open price is high and the close price is quite same, and there is a lower shadow between the two prices. The fifth is three dark crows, this pattern helps traders to predict the current uptrend in the market. This pattern is formed when there is 3 long candlestick that have near lower than the previous day. The traders use this pattern as a signal that the momentum is essentially changing.
The sixth is three white soldiers; this pattern is a couple of three dark crows. This pattern shows information about the current downtrend and this pattern consist of three long-bodies bar that have near higher than the previous day. Traders will get information about the investment sentiment and a shift of momentum.
Opposite of three white soldiers is three black crows consists of three long black candlesticks with consecutively lower closes. The closing prices are near to or at their lows. When it appears at top it is considered as a top reversal signal.
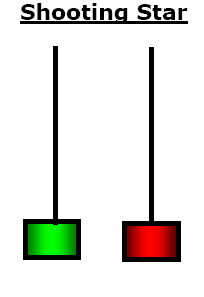
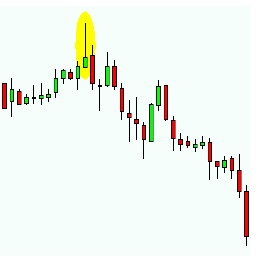
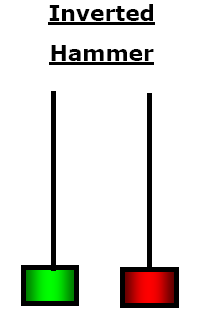
The last is inverted hammer. This pattern shows the bottom of a market trend and is a couple of shooting star candlestick pattern which shown the top of a market trend. The inverted hammer is a bullish reversal pattern, traders can see inverted hammer pattern at a bottom of forex trend. This pattern points out a possibility of the downward forex trend. How the pattern helps trader when they are executing, this pattern indicates “buy” time when the candle close above neckline and “stop” buying when the price is getting lower. Definitely this is really helpful for traders because traders get warning when they should and stop buying currency. Those are some strategies in reading candlestick both bearish and bullish in trading forex, there are other strategies that close to those strategies and you can pick one of strategies for helping you make decision. Trading forex needs a strategy that will make you gain profit and won’t make you loss much money.
Once again, recommendation time frame using at least four hours or daily and weekly more better. More biggest time frame on using this reversal bullish and bearish candlesticks patterns so more strong support resistance will made. And just for sharing, download ebook forex candlestick bible by Munehisa Homma.


