Here, we will explain the basics of the supply demand strategy in trading forex. Areas that we cover here include supply zone, demand zone, and equilibrium. We will also explain the basic concepts like law of supply demand and give some examples to make it easier to understand. Let’s start now.
Defining Supply and Demand
For the starter, let’s define supply and demand first. What is supply? In economic terms, supply is defined as the number of goods and/or services that producers are willing to sell at a certain price. What is demand? Demand is the number of goods and/or services that consumers are, not just willing, but also able to buy at a certain price.
Note the emphasis on the ability to buy in the law of demand. If a consumer is willing to buy a good or service but they aren’t able to do so, by definition they don’t have effective demand. Or in other words, it just doesn’t count. Next, how does the law of supply demand apply to forex trading? Here are the laws in brief.
• The law of supply
The law of supply is from the producers’ perspective. It goes like this: the higher the price of a given good/service, the more supply there will be. If the price of a given good/service is increasing, producers will supply said goods/services more to the market as they seek more profits.
• The law of demand
This law stands opposite to the law of supply as it is seen from the consumers’ perspective. According to the law of demand, the lower the price of a given good/service, the more demand it will have. If the price a given good/service is decreasing, consumers will demand the good/service more.
Examples
Let’s try with supply and demand examples. Let’s say you are trading EURUSD. You notice that the price of the currency pair is increasing. What do you think will happen next? According to the law of supply, what will happen next is the increase in supply quantity as more people are willing to sell to gain profit.
Next, switch the perspective to the buyers’ perspective. Let’s say that the price of the currency pair is decreasing. If that is the case, then there will be more demand for the EURUSD currency pair as more buyers will be interested in buying it. This is the law of demand at work.
The laws apply to opposite scenarios as well. According to the law of supply, as the price of the currency pair goes lower, there will be less supply quantity. Similarly, according to the law of demand, as the price of the currency pair goes higher, there will be less demand quantity. Yes, as simple as that.
You might wonder who determines the movement of price in the forex market. The answer is the players. Who are the players? The players are banks, governments, funds, investors, and speculators. Through the actions of these players, the supply and demand, and thus the price, changes constantly in the forex market.
Equilibrium, the Point of Balance
What will happen if there is the same amount of supply quantity and demand quantity? It will be supply and demand equilibrium, where there is as much demand as supply. If the law of supply demand is drawn on a graph, the equilibrium is where the two lines make a contact.
Although there is a point of balance between supply and demand, it is very unlikely to last long. This is particularly true for the forex market as it is very volatile. Price changes very, very quickly. That said, there are patterns and zones that we can observe and exploit to gain profit.
The Patterns
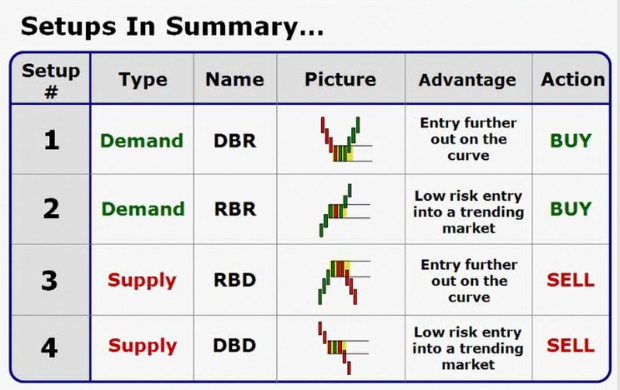
Naturally, you would ask how to identify fresh forex supply demand zone. Don’t worry. We will get into it shortly. Before that, you should know the four patterns of supply and demand in the forex market first. These patterns are rally-base-drop, rally-base-rally, drop-base-rally, and drop-base-drop. We explain each below.
1. Rally-Base-Drop
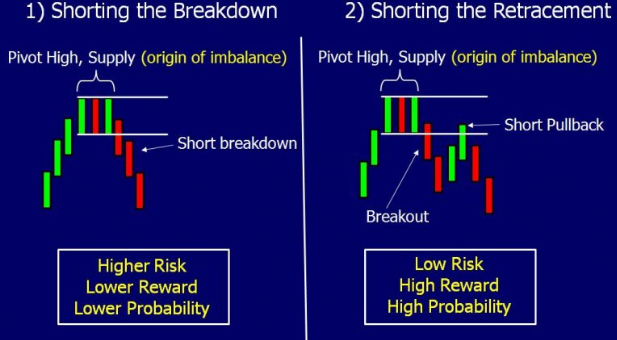
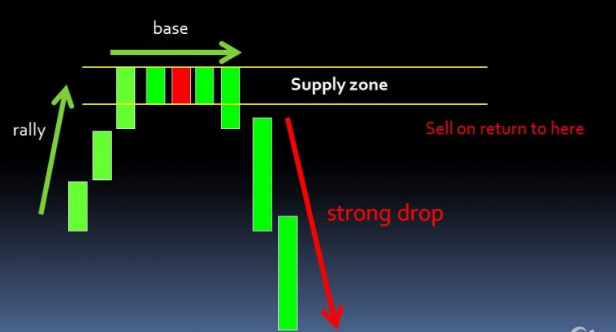
Each and every name of a pattern describes it. In this case, rally-base-drop occurs when there is a rally to a zone, immediately followed by a consolidation which creates the base (usually a short one), and finally, ended with a strong bearish or dropping movement away from the area. The pattern looks like an inverted ‘V.’
2. Rally-Base-Rally
Next, rally-base-rally. The pattern occurs when there is a rally to a zone, then immediately followed by a consolidation which creates the base, and finally, ended with another rally up or a bullish movement. The pattern looks like a steep diagonal line starting from bottom left to top right.
3. Drop-Base-Rally
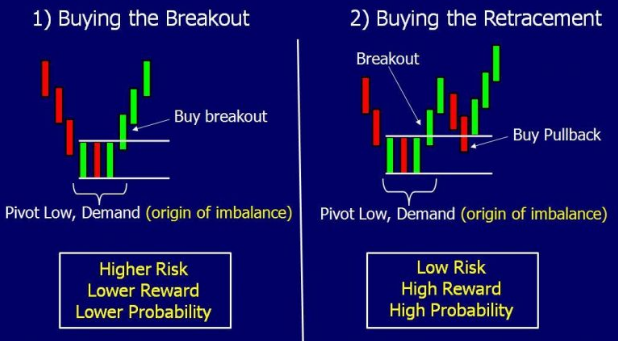
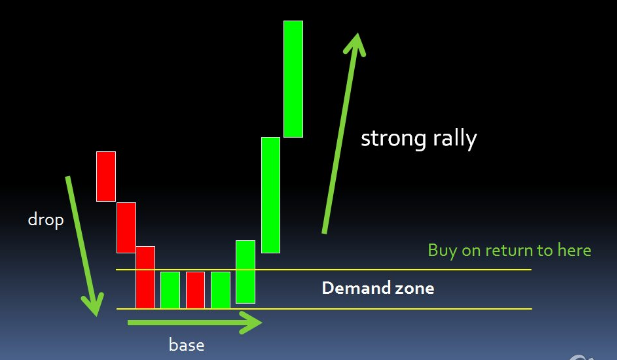
The third one is the drop-base-rally pattern. This pattern is established when there is a bearish movement that moves to a demand zone, then followed by a consolidation, and closed by a bullish movement up. It is the inversion of the rally-base-drop pattern. The pattern looks like a ‘V’ on the graph.
4. Drop-Base-Drop
The last pattern is drop-base-drop. The pattern occurs when there is a downward movement towards a consolidation zone, in which the downward movement is halted for a while, and followed by another downward movement. This is the inversion of rally-base-rally pattern and looks like a diagonal moving from top left to bottom right.
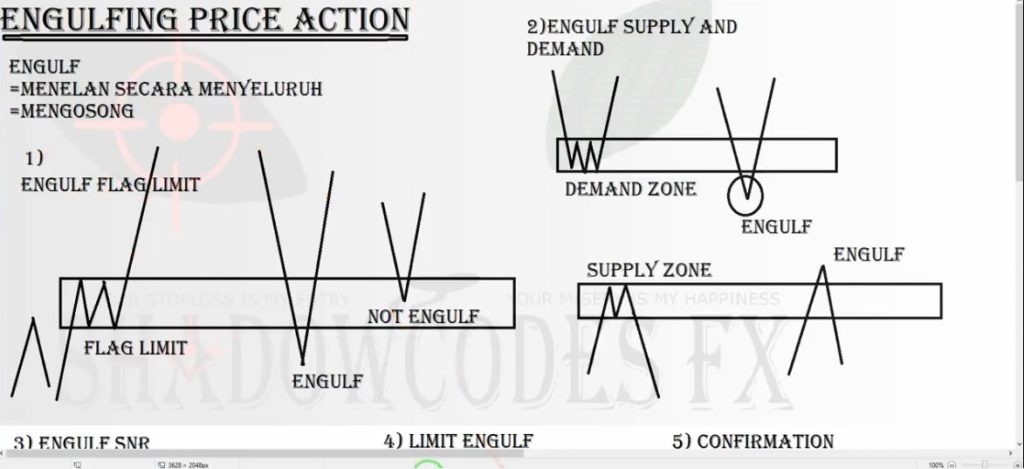
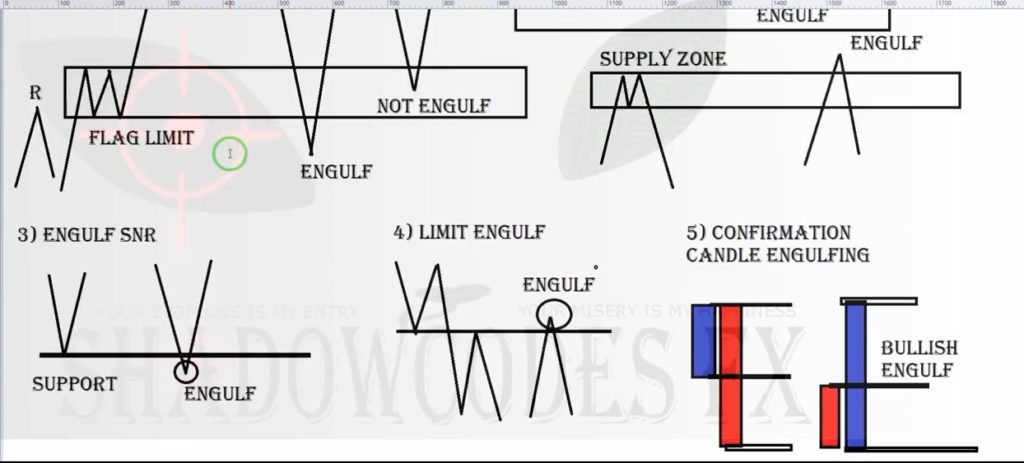
The most important thing is we’ve only trade in a based (Rally-Base-Drop, Rally-Base-Rally, Drop-Base-Rally,Drop-Base-Drop) and in engulfing area.
THE GOLDEN RULES OF SUPPLY AND DEMAND TRADING
1.ALWAYS SELL AT SUPPLY
2.ALWAYS BUY AT DEMAND
3.ALWAYS LOOK TO THE LEFT OF THE CHART
The Zones
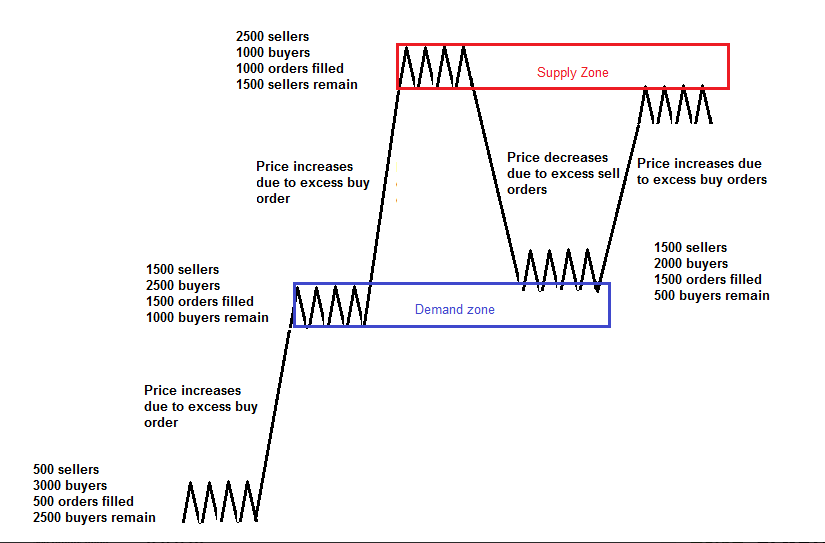
The zones here mean the points where price changes, either increasing or decreasing, very sharply. These zones indicate that the balance of supply and demand equilibrium has shifted significantly. Recognizing these zones will be very beneficial for a trader.
Now, let’s get more specific with the forex supply demand zone. Considering how dynamic the supply and demand in the forex market is, you can see any forex chart as continuous sequences of zones, which are comprised of supply and demand equilibrium and imbalances. And the zones are the areas where the price either bounces up or down.
• What is the supply zone?
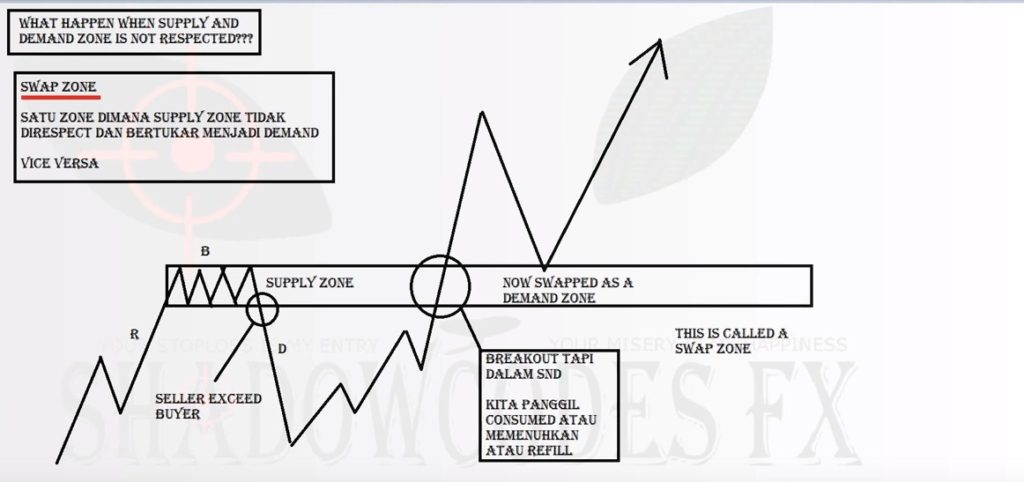
It is a horizontal zone in which numbers of abrupt selling has been done. Due to the sudden selling, the supply and demand equilibrium is disturbed, thus resulting in an imbalance. Now that the supply quantity exceeds the demand quantity, the price is pushed down, thus the bearish movement.
• What is the demand zone?
It is the horizontal zone in which numbers of abrupt buying has been done. The sudden buying here creates a supply and demand imbalance now that the demand quantity exceeds the supply quantity. Consequently, the price is pushed up, thus the bullish movement.
Usually, when selling or buying is done, you can the price is consolidating. You can see this in-between the patterns we explained before. There is a short and narrow consolidation zone that creates the base. After this short consolidation, you can see either the price has a sharp bullish or bearish movement.
Identifying the Zones
Let’s move to the last part of our guide. Now that you know the supply and demand patterns and zones, the next question to ask is how to identify fresh forex supply demand zone. Identifying fresh supply and demand zones is quite straightforward. Below are three steps you can use to identify the zones.
1. Take a good look at the chart
First thing first, look at the chart. To identify supply and demand zones, you will need a bird’s eye view of the chart so you can get find the overall price movements. We suggest you zoom out and set the time frame higher, about 4 or 5 times of your current trading time frame.
2. Find turning points
Next, spot the turning points. You should see multiple points at which the price moves, either up or down, significantly. To make things simple, you can call a level where the price moves downward quickly as a supply level. Likewise, you can call a level where the price moves upward quickly as a demand level.
If price movement down significantly, the supply zone having high probability turning point.
If price movement up significantly, the demand zone having high probability turning point.
Learn more about how to looking high probability turning point level in forex market with sam seide video.
3. Draw a long rectangle
Then, draw a straight, long rectangle that connects the supply levels and demand levels. The supply zone is on the upper part of the chart while the demand zone is on the lower part.
Closing
These are the basics trading forex with supply demand strategy. In all trading’s core, including forex trading, there is the law of supply demand at work. This is the reason why applying the law in forex trading is such a powerful strategy a trader can use. Knowing what it is and how it works is only the first step.
We have explained to you many important concepts and basics of the strategy, from the supply, demand, the laws, patterns, zones to how to identify fresh forex supply demand zone. At the least, it should make you better informed and equipped to do your trading using the strategy. We hope our brief guide here is helpful to you. Try learning more about forex supply demand technique by reading forex supply demand ebook from sam seiden fxstreet and combined it with reversal candlesticks patterns strategy. Good luck.


